Fitting Qwen3.8-27B on One RTX 3090: The Memory Math Is Wrong in Both Directions
A 27B model with 262K context on a single 24 GB card. The obvious memory arithmetic overestimates the cost by 4x, then underestimates the ceiling. What actually fits, how fast it runs, and where the efficiency knee sits.
I got the memory budget for this model wrong by a factor of four. Then I corrected it and got it wrong again in the other direction.
Both mistakes came from the same place: opening config.json, reading num_hidden_layers: 64, and believing it.
Qwen3.8-27B is a dense 27-billion-parameter model with a 262,144-token context window. I wanted it on a single RTX 3090: 24 GB, Ampere, a card that has been mid-range for three years. The conventional wisdom is that you pick your quantization, subtract the weights from your VRAM, and whatever is left is your context budget. That arithmetic is wrong here in a way that matters, and correcting it is the difference between a 32K context and a 131K one.
Abhinav’s Home AI Lab, part 2 got llama.cpp running alongside Ollama. This is one model on one card: what fits, what makes it fast, and what the numbers say once you stop estimating and start measuring.
The layers do not all cost the same
Here is the part of the config that matters, and it is not the line everyone reads:
{
  "num_hidden_layers": 64,
  "layer_types": ["linear_attention", ... 48 total ...,
                  "full_attention",   ... 16 total ...],
  "full_attention_interval": 4,
  "num_key_value_heads": 4,
  "head_dim": 256
}
Sixty-four layers, but only sixteen of them are full attention. The other forty-eight are Gated DeltaNet: linear attention that carries a fixed-size recurrent state instead of a growing cache.
The difference is the difference between a hotel that keeps a room reserved for every guest who has ever checked in, and one that keeps a single ledger and updates it. The first grows without bound. The second does not grow at all.
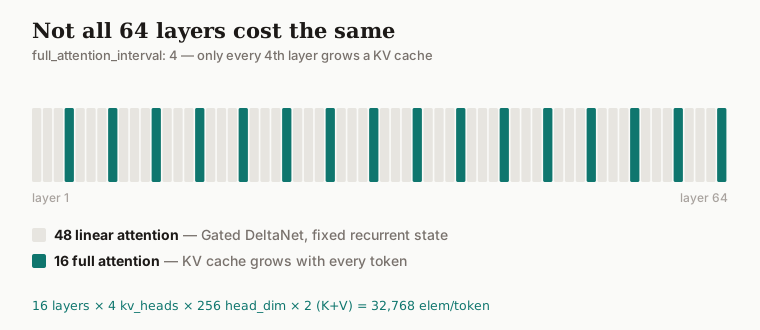
So the KV cache cost is sixteen layers, not sixty-four:
16 layers × 4 kv_heads × 256 head_dim × 2 (K and V) = 32,768 elements/token

  f16    64 KB/token
  q8_0   32 KB/token
  q4_0   16 KB/token
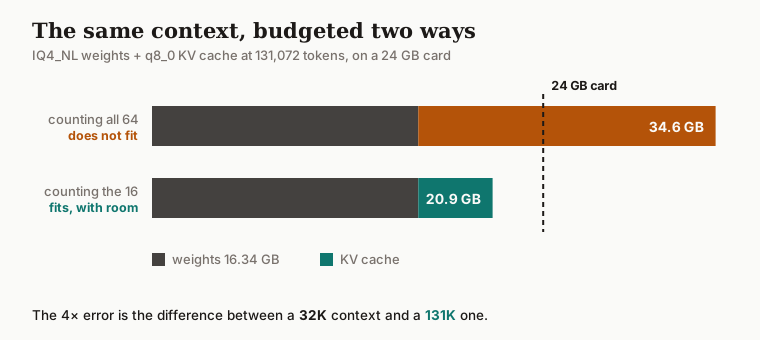
My first pass multiplied by all 64 and concluded that a 128K context needed 34 GB of cache alone, more than the entire card. On that arithmetic, the model’s advertised context is a fantasy on consumer hardware.
That number was four times too large. The advertised context is not a fantasy.
Then the correction was also wrong
Having found the error, I did the obvious thing and concluded that if KV is 4× cheaper than I thought, the full 262K window fits with room to spare.
It does not. The boot ladder:
| context | result |
|---|---|
| 131,072 | boots |
| 196,608 | fails — failed to allocate compute pp buffers |
| 262,144 | fails — failed to allocate buffer for rs cache |
Two terms that KV math does not include, and both of them are in those error messages.
Compute and graph buffers scale with context. I had treated them as a fixed overhead of about a gigabyte. At 196K they are what runs out, before KV becomes the binding constraint.
The recurrent state is not KV, so no KV formula counts it. Those 48 DeltaNet layers each carry a state that a cache-size calculation correctly ignores, because it is not a cache. It still occupies memory. At 262K that rs cache allocation is what fails.
Both omitted terms are small at 131K and grow from there, which is precisely where a ceiling lives. The rule I would take away: on a hybrid-attention model, KV arithmetic gives you a lower bound on memory, never a ceiling on context. Measure the ceiling. There is no shortcut.
Credit where it is due. The club-3090 project had already measured this ladder on the same hardware, and their config headers document the same two errors. I reproduced their result rather than discovering it.
Allocating 131K is not the same as filling it
Their own config header warns about exactly this:
an allocation that boots is NOT an allocation that fills
Their note records that the previous generation, Qwen3.6-27B, boots happily at 262K and then walls at around 125K in practice. Reserving memory is not the same as being able to use it.
So I tested it properly. I planted a sentence (an invented authorization codeword) at 10% depth in a long filler document, asked for it back at the end, and checked for an exact string match. Then I walked the depth up.
| prompt tokens | prefill | wall clock | needle |
|---|---|---|---|
| 4,613 | 960.7 tok/s | 5.1 s | found |
| 18,190 | 1,143.3 tok/s | 17.1 s | found |
| 63,513 | 920.7 tok/s | 71.2 s | found |
| 95,814 | 805.9 tok/s | 124.4 s | found |
| 127,527 | 720.3 tok/s | 184.7 s | found |
At full depth: 22,618 MiB of 24,576 used, 1,708 free, 54 °C.
131K allocates and fills. Prefill degrades gracefully from 1,143 to 720 tok/s rather than falling off a cliff, and there is no sign of the prefill failure that kills the other obvious runtime on this card. More on that below.
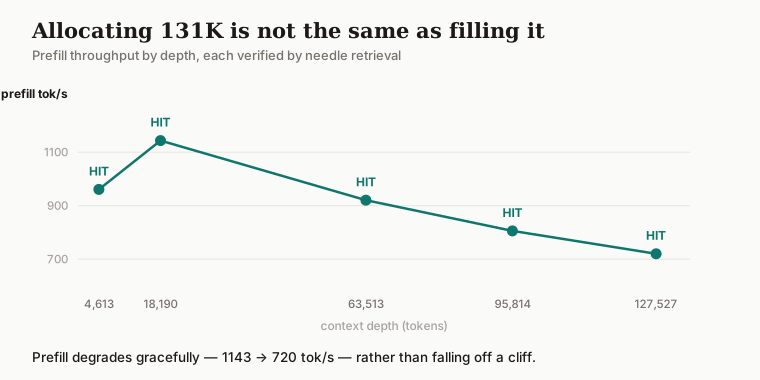
One number there deserves more attention than the others: 184.7 seconds. Three minutes to ingest 128K tokens. Fine for a document you hand it once, unusable as a per-turn cost in an agent loop, and no amount of tuning changes the order of magnitude. Long context on one card is a batch capability, not an interactive one.
So much for what filling the context costs in wall clock. What it costs in generation speed afterwards is a separate question, and one I have not answered here.
Why not vLLM
The obvious objection to all of this is that llama.cpp is the wrong tool and vLLM is faster. On one 24 GB card, for agentic work, it is not an option, and the reason is specific rather than a matter of taste.
vLLM’s Gated DeltaNet prefill path allocates an intermediate tensor shaped [1, T, H, D] with 48 value heads at tensor-parallel 1, and it grows linearly with sequence length. Single prompts run out of memory past roughly 50K, and club-3090 reports the multi-turn variant firing within a handful of agentic turns regardless of configuration. It is not closed.
The workarounds are a second card, or llama.cpp, whose online state update never materialises that tensor at all.
One thing to check before you download the wrong file: the FP8 and NVFP4 builds of this model are useless on a 3090. FP8 needs compute capability 8.9 and the card is 8.6; FP4 is Blackwell only. They are the ones that look most modern.
The model ships its own drafter, and it is worth 1.6x
Buried in the config is mtp_num_hidden_layers: 1. There is a multi-token prediction head baked into the weights: a small drafter that proposes the next few tokens so the full model can verify several per forward pass instead of one.
llama.cpp exposes it as --spec-type draft-mtp, and the effect is not subtle:
| MTP on | MTP off | |
|---|---|---|
| generation | 58.2 tok/s | 35.6 tok/s |
| draft acceptance | 375/446 = 84.1% | — |
| average clock | 1524 MHz | 1883 MHz |
| average power | 292 W | 377 W |
| tokens per kJ | 199 | 94 |
Roughly 1.6× the throughput while drawing 85 W less, which sounds like it should not be possible.
The reason it works is that decode on a card like this is bound by memory bandwidth, not arithmetic. The GPU spends most of each token waiting to read weights out of VRAM. Verifying two tokens per forward pass gets more work out of the same memory traffic. Without the drafter, the card sits at 1883 MHz and 377 W producing half the output, burning clock speed against a wall that clock speed cannot move.
One trap worth knowing. Unsloth ships a separate -MTP-GGUF repository for the previous generation, so the absence of that suffix on the 3.8 repository reads as “this build has no drafter.” That inference is wrong; 3.8 bakes the head into the standard build. Repository naming is not evidence about what is in the file. The tensor table is.
The inherited setting was not the best one
Every published configuration I could find uses --spec-draft-n-max 2, inherited from the previous generation’s setup, where it is explicitly flagged as unmeasured for this model. Since I now had a benchmark, I swept it.
| draft depth | tok/s | tokens per kJ |
|---|---|---|
| off | 35.63 | 94.4 |
| 1 | 48.50 | 178.1 |
| 2 | 56.62 | 209.8 |
| 3 | 56.75 | 208.9 |
| 4 | 60.27 | 218.8 |
| 5 | 56.04 | 202.9 |
| 6 | 53.39 | 191.3 |
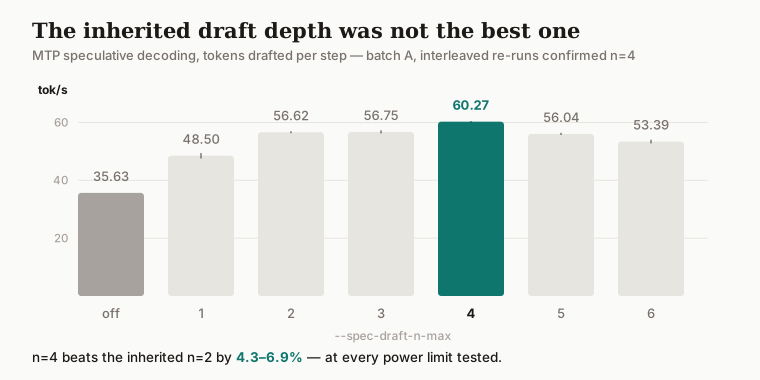
n=4 came out 3.5 tok/s clear of both its neighbours. A non-monotonic spike like that is usually an artifact rather than a finding, so rather than trust it I re-ran it interleaved against n=2, and then again at stock power in case the win was an artifact of my power cap. It held both times: +4.3% at 75%, +6.9% at 100%.
About 5% of throughput was sitting on the floor in every published config, purely because a value nobody had measured got copied forward.
The stock power limit is the worst setting on the card
The 3090 ships with a 390 W limit. I swept it downward, three runs per point:
| limit | tok/s | vs stock | avg W | avg MHz | tok/kJ |
|---|---|---|---|---|---|
| 100% · 390 W | 60.93 | — | 338 | 1749 | 180.1 |
| 80% · 312 W | 58.60 | −3.8% | 280 | 1610 | 209.5 |
| 75% · 292 W | 57.52 | −5.6% | 260 | 1425 | 221.6 |
| 65% · 253 W | 51.11 | −16.1% | 230 | 1076 | 222.7 |
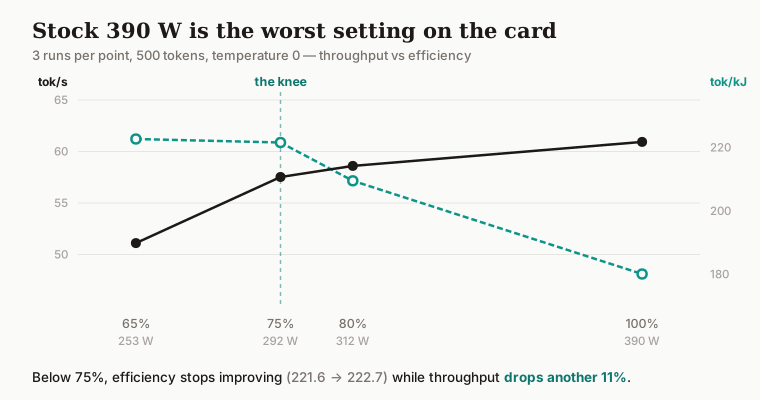
Read the last column. Going from 100% to 75% buys a 23% efficiency gain. Going from 75% to 65% buys half a percent, and costs another 11% of throughput.
The knee sits at 75%. Efficiency climbs steeply until then and flatlines after; throughput is nearly flat until then and falls off after. The two plateaus cross at exactly the point where the card stops being bandwidth-limited and starts being clock-limited.
Stock 390 W was the worst setting I measured on every axis except raw speed, and it was only 5.6% faster than a configuration drawing 78 W less on average and 86 W less at peak. On a card sharing a case with everything else, that is real heat you are buying almost nothing with.
What I could not measure, and one number to distrust
The most important caveat is about my own methodology, and it invalidates part of what is above if you read it carelessly.
The same configuration, measured at four different times, all at n=2:
| when | limit | tok/s |
|---|---|---|
| power sweep | 100% | 60.93 |
| draft sweep, batch A | 75% | 56.62 |
| draft sweep, batch B | 75% | 60.91 |
| draft sweep, batch C | 100% | 55.90 |
Read across those and they are incoherent. The last row says stock power is slower than a 75% cap, which cannot be true. Clocks rule out a clock explanation: that batch averaged 1825–1867 MHz against the power sweep’s 1749. Higher clocks, lower throughput.
Most likely heat soak, or shifting desktop load on a machine I was also using. Magnitude is roughly ±10%.
The consequence is that only within-batch comparisons in this post are valid. Every conclusion here rests on an interleaved pair measured back to back: MTP on versus off, n=4 versus n=2, the power points collected in one sitting. None of the absolute numbers should be quoted against each other.
That is also why I have given throughput as a range, roughly 56 to 64 tok/s, rather than a tidy single figure. A point value would be picking one arbitrarily and dressing it as precision.
Three other things I did not establish:
I never compared quantizations. I adopted IQ4_NL from club-3090’s single-card config because it fits with a serving-grade KV cache at 131K. I verified it fits and fills. I never benchmarked Q4_K_M or UD-Q4_K_XL against it for either speed or quality, so “IQ4_NL is the right choice” is a claim I am borrowing, not one I tested.
I measured no output quality at all. Every number here is throughput or memory. None of them speak to whether the answers are good.
Every throughput number above was measured with an almost empty context. That is how these things are normally benchmarked, and it is what I did. It is also the wrong operating point for a coding agent carrying tens of thousands of tokens of source and conversation, and I have no idea yet how far the figures move once the cache is full. Attention over a deep cache is more expensive per token, so they should move down. By how much, and whether the drafter still earns its keep at depth, I cannot tell you.
A published figure I could not reproduce. A widely shared result reports 82 tok/s on a 3090 at around 250 W. At 253 W I measured 51.
I want to be careful here, because the easy dismissal is wrong. That 82 is a single-request number, not a batching artifact; the same write-up quotes 417 tok/s separately for 64 concurrent requests. So it is measuring the same thing I am, and it is 60% faster.
The difference is the whole stack underneath. That result is vLLM with W4A16 weights, an fp8 KV cache, and int8 lm_head and embeddings, which comes to 14.2 GB against my 16.34 and buys more context than I have as well. It pays for that in quantization loss it estimates at 0.6% on the head and embeddings.
So the gap is real and the card is not what causes it. llama.cpp against vLLM, and a conservative quantization against an aggressive one. If you come to this post expecting 82 tok/s from llama.cpp at IQ4_NL you will be disappointed, and the fix is a different engine rather than a different setting.
The same author has since pushed it to 99 tok/s single-request, which widens the gap rather than closing it.
The config, and three flags that look like mistakes
llama-server --host 127.0.0.1 --port 8086 \
  -m Qwen3.8-27B-IQ4_NL.gguf --alias qwen3.8-27b \
  -c 131072 -b 4096 -ub 512 -ngl 99 -fa on \
  --cache-type-k q8_0 --cache-type-v q8_0 -np 1 \
  --spec-type draft-mtp --spec-draft-n-max 4 \
  --jinja --reasoning off \
  --temp 0.7 --top-p 0.80 --top-k 20 --presence-penalty 1.5
Plus a 75% power limit set on the host.
-np 1 — one slot, no parallelism. Each slot takes its own slice of the KV pool, so two slots would halve your context, and on a single card serving a single user they divide throughput rather than multiplying it.
-ub 512 — a conservative micro-batch. This is the lever that breaks first when headroom is tight; raising it fails to allocate at this context.
--reasoning off — inherited from the config I started with, and the one flag here I have not justified with a measurement.
What you get: roughly 56–64 tok/s on an empty context, 84% draft acceptance, a 131K context that genuinely fills, ~720 tok/s prefill at full depth, and about 260 W under load.
Check the inherited numbers
None of the interesting results here came from tuning. They came from checking inherited numbers.
The memory ceiling was in a config file I read too quickly. The draft depth was a value copied forward from a different model with a note attached saying it was unmeasured. The power limit was a default. Each one was sitting in plain sight, and each one was wrong or suboptimal for this specific combination of model and card.
The argument is for running the five-minute experiment before accepting a value, especially on hardware where the defaults were chosen for something else.
The single-card 24 GB tier gets treated as a compromise. It is not, for this model. You get the full advertised context depth, verified by retrieval rather than assumed, at around 60 tokens per second, on a card you can buy used. You just have to measure it yourself, because the arithmetic will lie to you in both directions.
Which leaves the thing that bothers me about everything above.
Every speed figure in this post was taken on a near-empty cache, because that is the easy measurement and the one everybody publishes. But I did not buy 131K of context to leave it empty. The whole point was to put a codebase in there. And a coding agent forty thousand tokens into a session is running at an operating point I have not benchmarked once.
There are three questions I cannot answer from anything here. How far does decode throughput fall as the cache fills. Whether n=4 still beats n=2 at depth, or whether deeper speculation stops paying when the prediction gets harder. And what --reasoning off is actually worth, since I inherited it and never tested it.
Next I go and measure those, at the depth I actually work at.
Stay in the loop
New posts on AI security, responsible AI evaluation, and agentic systems — no noise, no cadence pressure. When there's something worth reading, it lands in your inbox.