Your Empty-Context Benchmark Is Not Your Real Throughput
Most local-model benchmarks report one tok/s number from a short, fresh prompt. On my 3090, context depth, workload, reply length and reasoning effort all moved that number, and at the default reasoning effort one coding prompt spent its whole budget thinking and produced no answer.
If you followed the last post and got a model running, the first thing you will notice after a few hours of real use is that it gets slower. Not at startup but partway through a long session, gradually, in a way that is easy to blame on the card getting hot.
It is not the card overheating. The same configuration that does 65 tokens per second on a fresh conversation does 47 once there are a hundred thousand tokens behind it. Nothing is misconfigured when that happens.
That post ended with three questions I could not answer: how far decode throughput falls as the cache fills, whether --spec-draft-n-max 4 still beats 2 at depth, and what --reasoning off was actually worth. Measuring those turned up two more things I had not thought to ask about: what the model is generating moves the number more than I expected, and the drafter I shipped costs memory I never mentioned.
The model slows down as the conversation grows
Everything in the last post was measured with an almost empty cache, which is the normal way to benchmark a model and what every figure I could find online reports, club-3090’s included. It is also the wrong operating point for what I actually want the thing to do, which is sit behind a coding agent with tens of thousands of tokens of source and conversation already resident.
Decode gets more expensive as context grows, though less of the model is responsible than you might assume. Qwen3.8 is a hybrid: the GGUF reports full_attention_interval = 4, so of its 64 blocks only 16 are full attention. The other 48 carry a fixed-size recurrent state rather than a cache that grows. Those 16 full-attention layers have attention work that grows with context, which is enough to give this model a depth-dependent decode cost even though most of it runs on fixed-size state.
So I ran the same benchmark again at 0, 8K, 32K, 64K and 110K tokens of context, across three draft settings, interleaved and repeated. Nothing is reconfigured between those rows; the only thing that changes is how much is already in the cache.
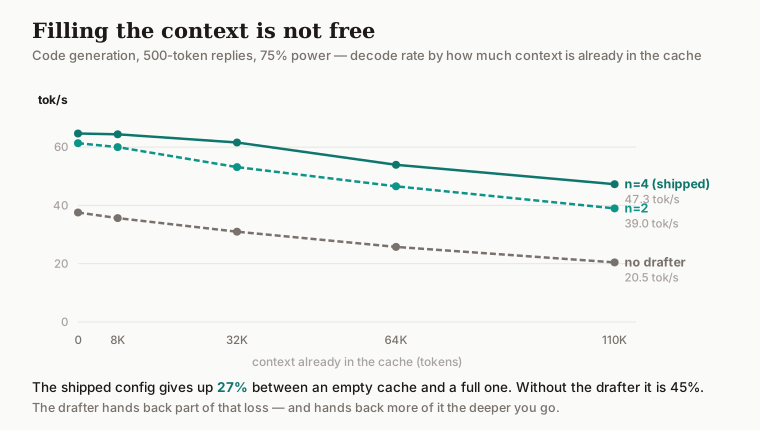
| context | no drafter | n=2 | n=4 |
|---|---|---|---|
| 0 | 37.57 | 61.34 | 64.68 |
| 8,192 | 35.65 | 60.01 | 64.39 |
| 32,768 | 31.00 | 53.16 | 61.60 |
| 65,536 | 25.76 | 46.56 | 53.93 |
| 110,592 | 20.46 | 38.98 | 47.30 |
The shipped configuration gives up 27% of its decode rate between an empty cache and 110K tokens, 64.7 tok/s down to 47.3.
The no-drafter column falls further, 45% rather than 27%: speculative decoding does not remove the cost of a deeper cache but it offsets some of the loss. That 45% is the softest number here, since with no drafter the card sits pinned against its power limit and down-clocks as the context grows, so some of it is the cap rather than attention.
None of this is the cost of reading a long prompt in, which is mostly a one-time charge for as long as the prefix stays cached. This is the cost of generating against a cache that is already full, which caching does not touch.
The draft depth advantage grows with the cache
Last post I found --spec-draft-n-max 4 beat the inherited 2 by 4.3–6.9% and shipped it. That was measured on an empty cache, and the advantage grows as the cache fills.
n=4 against n=2, code generation, reasoning off:
| context | n=4 vs n=2 |
|---|---|
| 0 | +5.5% |
| 8,192 | +7.3% |
| 32,768 | +15.9% |
| 65,536 | +15.8% |
| 110,592 | +21.3% |
A difference counts as real here only when it clears the two configurations’ standard deviations added together, over four repeats per cell run in order-reversed blocks. That is a conservative threshold of my own rather than a significance test, and it applies everywhere else in the post.
The advantage at 110K is roughly four times the advantage at an empty cache.
I ran the same ladder with reasoning on as well, at the default effort. Those runs produced no code at all, for reasons the next section covers, so the rate they report is the rate of thinking and I have kept them out of the table above. The two draft depths can still be compared against each other on it, and nothing separated them.
Code, prose and reply length all move the number
I ran the depth ladder twice, once asking for code and once for a prose explanation, with nothing else changed.
| code | prose | |
|---|---|---|
| decode rate | 57.1 tok/s | 52.6 tok/s |
| draft acceptance | 57.7% | 49.4% |
Generation length moves it again. 500-token replies run 11.8% faster than 200-token ones on the same prompt, and acceptance climbs from 58.4% to 68.9% over that stretch. My guess is that the opening of a red-black tree implementation is the hard part and the later tokens are more boilerplate, but I measured the effect rather than the reason.
These were separate experiments, so I would not fold them into a single number. Content moved throughput by 8.6%, reply length by 11.8%. Across the cells I actually ran, the slowest and the fastest sit about 24% apart, which is a range rather than an effect.
The server flags never changed for any of this. On a speculative-decoding setup the prompt belongs in the method, because throughput tracks acceptance and acceptance moved substantially with the workload.
The cap belongs there too. Mine was 500 tokens; let the same red-black tree prompt run to its natural end and it reports 71.2 tok/s at 80.6% acceptance, which is where the next section starts.
The default reasoning effort spent 8,000 tokens and wrote no code
The config I shipped has --reasoning off, a default I never questioned even though reasoning is on in most of what I do with this model day to day.
My first attempt capped generation at 500 tokens, far too short: every reasoning-on run spent its whole budget thinking and never started the reply, so I had measured the decode rate of deliberation rather than of code. I ran it again with room to finish, every effort level against both prompts, 8,000 tokens, three repeats per cell with the order reversed between them.
| tok/s | acceptance | finished | wall | |
|---|---|---|---|---|
| code, reasoning off | 71.2 | 80.6% | 3 of 3 | 75s |
code, low | 66.3 | 72.6% | 3 of 3 | 115s |
code, medium | 63.1 | 67.9% | 3 of 3 | 121s |
code, xhigh (the default) | 45.3 | 38.5% | 0 of 3 | 177s |
| prose, reasoning off | 50.5 | 46.6% | 3 of 3 | 59s |
prose, low | 48.6 | 42.9% | 3 of 3 | 89s |
prose, medium | 48.8 | 43.4% | 3 of 3 | 110s |
prose, xhigh | 46.9 | 41.0% | 3 of 3 | 171s |
At the default effort the code prompt never produced code. Three runs out of three spent the entire 8,000 tokens thinking and stopped there, 177 seconds in.
Set the effort yourself and it finished every time. low returns a complete implementation and costs 6.9% in decode throughput against reasoning off, which is not the same as costing 6.9% of your time. low took 115 seconds against 75 with reasoning off, because it generated 7,585 tokens where the plain answer took 5,317. The per-token rate barely moves; you are simply paying for 43% more tokens, and the wall clock is 53% longer. Whether that is worth it depends on whether the thinking improves the answer, which I have not measured.
The cause is a setting I had never sent. The chat template shipped with this checkpoint defaults reasoning_effort to xhigh, and on the llama.cpp build and template I tested there is more than one way to end up there without meaning to:
| what I sent | what I got |
|---|---|
| nothing | xhigh |
high | xhigh, remapped silently |
none | a reply byte-identical to sending nothing |
minimal or max | HTTP 500 |
The none row is the one worth explaining, because three layers disagree about it. Unsloth’s model page lists it as a level. llama.cpp’s server code special-cases it, with the comment "none" disables reasoning. Neither happened for me: my server runs --reasoning on, which injects enable_thinking into the template kwargs, and the request field never gets past it.
That is the shape of the whole problem. llama.cpp’s API, the chat template and the model each have an opinion about reasoning, the names overlap, and the one that wins is not always the one you set.
Acceptance tracks the shape of the table closely. Code drafts at 80.6% with no thinking, 72.6% at low, 38.5% at xhigh, and throughput follows it down. On these two prompts the code output was far easier for the draft head to predict than the reasoning was.
Prose hardly moves: 50.5 down to 46.9 across the whole range, with acceptance never far from 45%. It was not very draftable to begin with, so it has less to lose. It also reaches an answer at xhigh where code does not, and the thinking on that prompt is shorter, around 18,000 characters against 31,000.
One thing to flag about how these ran. Qwen publishes separate sampling presets for thinking and non-thinking, and my server was set up with the non-thinking one, which carries a presence penalty of 1.5 where thinking mode wants 0.0. That penalty discourages tokens the model has already used, so it was a plausible reason the thinking never closed. I repeated the xhigh code run on the documented thinking preset: 31,250 characters of thinking, no answer, budget exhausted. Same outcome, so that sampling mismatch does not explain the result.
I measured the off rows with the server’s --reasoning off, which meant restarting between them and the rest, so I ran them twice, once before and once after, and they agreed to within 1%.
What the cheaper effort costs in answer quality I have not measured.
The drafter also costs memory, which I never mentioned
The last post presented the multi-token-prediction head as pure upside: 1.6× throughput while drawing 85 W less, no catch. Measuring the depth ladder meant loading the model with speculation on and off, which surfaced a catch I had not looked for.
| model VRAM | vs no drafter | |
|---|---|---|
| no drafter | 20,167 MiB | baseline |
n=2 | 21,423 MiB | +1,256 |
n=4 | 21,740 MiB | +1,573 |
With n=4 the process used 1,573 MiB more than with speculation off — about 1.54 GiB. Most of that looks fixed with respect to draft depth: doubling from n=2 to n=4 added only another 317 MiB. The fixed portion likely includes the drafter’s own weights, which the GGUF carries as one extra layer (nextn_predict_layers = 1), plus runtime allocations I did not measure separately.
A q8_0 cache on this model costs about 34 KiB per token once block overhead is included: 16 attention layers, 4 KV heads, 256 dims each for K and V, at 34 bytes per 32 values. So 1,573 MiB is the same amount of VRAM as roughly 47,000 tokens of cache, about a third of the 131K I run. Whether turning the drafter off actually raises the usable ceiling by that much, I did not test.
It costs prefill as well: about 10% on a cold ingest, and 7% on incremental appends to a warm cache.
Still worth it for interactive coding, where you rarely fill 131K. That 131K is my -c flag rather than the model’s limit, incidentally — Qwen documents 262,144 natively and a further extension through YaRN. Twice that context is roughly 8.5 GiB of q8_0 cache, which does not fit alongside the weights on one 24 GB card.
What to change, if you are running this yourself
Set reasoning_effort explicitly, if you use reasoning at all. It is not a server flag. It goes in the request, alongside messages and max_tokens:
{ "model": "qwen3.8-27b", "messages": [...], "reasoning_effort": "low" }Leave it out and the template picks xhigh. On this coding prompt low cost 6.9% in decode rate but 53% in wall time, for the reason in the table above.
Check the level you send against the template rather than against llama.cpp’s help, which advertises minimal through max as though any of them were available. This checkpoint’s template honours three of those, quietly rewrites high, and raises on the rest. That list has changed between template revisions, so read the one you actually downloaded.
Turn thinking off per request rather than per server. On the build I tested the reliable switch was chat_template_kwargs.enable_thinking, which is the channel llama.cpp passes template variables through:
{ "model": "qwen3.8-27b", "messages": [...], "chat_template_kwargs": { "enable_thinking": false } }Sending enable_thinking at the top level instead, as I first tried, is accepted and ignored, and the thinking comes back anyway. I restarted the server between my reasoning-on and reasoning-off runs for want of knowing that.
Expect the slowdown at depth and do not go looking for a fault. None of the settings I tested removes it. If you need that throughput back, shortening the active context is what worked.
Keep --spec-draft-n-max 4 for reasoning-off code generation. With reasoning on I measured no winner between the two, so if that is how you run the model this setting is not the lever, and either way the drafter wants the VRAM shown above.
Ignore all of this if you are chatting rather than building. Short conversations and short replies sit at the fast end of every curve in this post. The numbers here matter when something is holding tens of thousands of tokens open for hours, which is an agent, not a chat window.
And one correction that came from a reader
The last post said three minutes to ingest 128K tokens was “unusable as a per-turn cost in an agent loop.” A reader pointed out that prompt caching makes that wrong, and my own measurements agree with them.
The clearest pair I have is at 8K rather than 128K: the first request processed all 8,367 tokens cold, and the second reprocessed 516 against 7,851 cached — about a second. The 184.7 seconds is the cold 128K ingest, and the 8K repeat is what shows I should not have treated it as a per-turn cost. I did not capture a matched warm repeat at 128K itself, because the sweep walks upward through depths and never re-enters one with the full prefix intact.
That holds while the prefix is stable. An agent that edits or truncates history mid-context invalidates the cache from the point of divergence and pays again for everything after it, so the saved prefill cost returns whenever the prefix changes.
It does not change the decode cost. A cached 110K conversation still runs at 47 tok/s rather than 65.
That post conflated cold ingestion with the incremental cost of later turns. Prefix caching was active in those runs.
Benchmark at the operating point you run at
The last post argued for checking inherited numbers before trusting them: a config file I had read too quickly, a draft depth copied forward from a different model, a power limit nobody had questioned. That turned out to apply to my own measurements too.
If you go measuring yourself, interleave your configurations rather than running each for twenty minutes. Drift on this machine is about 10%, enough to swamp every effect in this post. The harness is on GitHub as ctx-bench: it points at a server you already have running and reports the depth ladder, the effort grid and the workload split, with the same noise threshold used here.
The narrower lesson is to benchmark at the operating point you actually run at, rather than the one that is convenient or the one everyone else reports. Depth, workload, reasoning mode and effort all change the number, and the right operating point for each depends on what you are doing.
A number that does not say what it was measured on is not describing your hardware. It is describing someone else’s afternoon.
Stay in the loop
New posts on AI security, responsible AI evaluation, and agentic systems — no noise, no cadence pressure. When there's something worth reading, it lands in your inbox.